Most solar battery guides teach you how to size a system. They hand you a formula, you plug in some numbers, and you walk away with a kilowatt-hour figure. What they almost never tell you is whether that system will still perform in year eight, whether it will survive a 40°C summer, or whether the money you spend will actually come back to you.
This guide covers all of it — from the first load calculation to a real cost-and-payback analysis that lets you make a genuinely informed decision.
What you will learn:
- The complete 8-step design process, with every loss factor included in the formulas
- How to choose the right battery chemistry for your climate and budget
- How to account for capacity degradation so your system does not underperform a decade from now
- A real case study — an off-grid cabin in tropical Southeast Asia — that runs through every step with real numbers
- A life cycle cost (LCOE) and payback calculation framework that no competing guide provides
- How to upgrade an existing lead-acid system to lithium without replacing every component

What Does a Solar Battery System Actually Consist Of ?
Before any calculation makes sense, you need a clear picture of how the components relate to each other and where energy is gained or lost at each stage.
The four core components
Solar panels (PV array) convert sunlight into direct current (DC) electricity. Their output varies with irradiance, temperature, shading, and the angle of incidence — which is why the rated wattage on the label is almost never what you actually harvest.
Battery bank stores the electricity generated during daylight for use at night or during overcast periods. The battery is the most complex and most expensive component to replace, which makes sizing and chemistry selection the most consequential decisions in the design process.
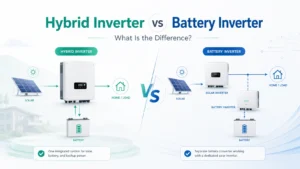
Inverter / charge controller manages two separate jobs. The charge controller (usually an MPPT unit in modern systems) regulates the current flowing from the panels into the batteries to prevent overcharging. The inverter converts stored DC electricity into the alternating current (AC) that most household appliances require. In hybrid and off-grid systems, these two functions are often combined in a single unit called an inverter-charger.
Battery Management System (BMS) monitors and protects individual cells within the battery pack. It guards against overcharge, over-discharge, overtemperature, short circuits, and cell imbalance. On lithium batteries, a BMS is non-negotiable — without it, a single malfunctioning cell can trigger thermal runaway. On DIY lead-acid systems it is sometimes omitted, but doing so shortens battery life significantly.
Energy flow in a typical system: Sunlight → PV panels → Charge controller (MPPT) → Battery bank (managed by BMS) → Inverter → AC loads (appliances). Grid-tied systems add a grid connection point after the inverter, allowing excess energy to be exported or grid power to be imported when batteries are low.
Grid-tied vs off-grid: the fundamental design difference
| Grid-tied with battery | Off-grid / standalone | |
|---|---|---|
| Primary goal | Bill reduction + backup power | Full energy independence |
| Grid as backup | Yes — grid provides security net | No — battery and/or generator only |
| Days of autonomy required | 0.5–1 day (overnight buffer) | 2–5 days (weather resilience) |
| Battery sizing emphasis | Smaller, optimised for daily cycling | Larger, sized for worst-case cloudy periods |
| Inverter type | Hybrid inverter (grid-interactive) | Off-grid inverter-charger |
| Regulatory complexity | Interconnection agreement required | Minimal, but building codes still apply |
| Typical system cost | Lower (less battery capacity needed) | Higher (full autonomy requires more storage) |
Identifying which category you fall into before any calculation begins is essential — the same 10 kWh battery bank is correctly sized for a grid-tied home but dangerously undersized for a remote off-grid cabin in a cloudy climate.

Step 1: Calculate Your Real Daily Energy Needs
The accuracy of every downstream calculation depends entirely on this step. Underestimate your load, and you will have a system that fails on the third overcast day. Overestimate it, and you will spend thousands on capacity you never use.
How to build a load table
List every electrical device you plan to power. For each one, record:
- Rated power (W) — found on the nameplate or in the manual
- Daily hours of use
- Daily energy consumption (Wh) = Power (W) × Hours
| Appliance | Power (W) | Hours/day | Daily Wh |
|---|---|---|---|
| Refrigerator (efficient, 12V) | 45 | 24 (cycling ~30%) | 324 |
| LED lighting (4 bulbs) | 40 | 5 | 200 |
| Ceiling fan | 60 | 8 | 480 |
| Laptop | 45 | 4 | 180 |
| Phone charging (×2) | 20 | 2 | 40 |
| Water pump (occasional) | 300 | 0.25 | 75 |
| Total | 1,299 Wh/day ≈ 1.3 kWh/day |
This is the example we will carry through every subsequent step in this guide — a modest off-grid tropical cabin with a daily load of approximately 1.3 kWh.
The three most common load estimation mistakes
1. Forgetting surge current on motor loads. A water pump rated at 300 W may draw 900–1,200 W for the first two seconds at startup. Your inverter must handle this peak, not just the steady-state wattage. If the inverter’s surge rating is insufficient, it will shut down or fail prematurely.
2. Ignoring standby power. A television on standby draws 1–5 W continuously. A router draws 8–12 W around the clock. A satellite receiver can consume 15 W in standby. Across a full day, these “vampire loads” can add 50–150 Wh — the equivalent of running an extra LED bulb for six hours.
3. Underestimating seasonal variation. An air conditioner used only in summer, a space heater in winter, or a chest freezer packed with extra food during holiday periods can temporarily double your daily load. Design for your peak seasonal load, not your average.
Step 2: Choose the Right Battery Chemistry for Your Situation
Once you know your daily energy requirement, the next decision — battery chemistry — will shape the long-term economics of the entire system.
LFP vs NMC vs lead-acid: a practical comparison
| LFP (LiFePO₄) | NMC (Lithium) | AGM Lead-Acid | Flooded Lead-Acid | |
|---|---|---|---|---|
| Cycle life at 80% DoD | 3,000–6,000+ | 1,500–3,000 | 400–700 | 300–500 |
| Usable capacity (DoD) | 80–90% | 80–90% | 50% | 50% |
| Energy density | Medium | High | Low | Low |
| Operating temp range | -20°C to 60°C | -20°C to 55°C | -20°C to 50°C | 10°C to 40°C |
| Self-discharge/month | ~2% | ~2–3% | ~5% | ~10–15% |
| Safety | Excellent (no thermal runaway) | Good (with BMS) | Moderate | Lower (hydrogen gas) |
| Cost ($/kWh, 2025) | $150–$250 | $180–$300 | $80–$130 | $60–$100 |
| Best for | Off-grid, long-term use | Space-constrained installs | Tight budget, mild climate | Budget off-grid (with maintenance) |
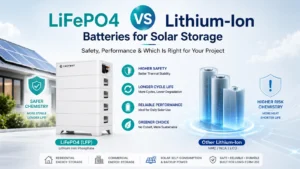
For most new residential and off-grid installations today, LFP is the default recommendation. Its combination of exceptional cycle life, inherent safety, wide temperature tolerance, and falling prices makes it the best long-term value in the vast majority of scenarios, even though the upfront cost is higher than lead-acid.
The one situation where lead-acid remains genuinely competitive is when the budget is severely constrained and the user is willing and able to maintain the batteries (checking electrolyte levels, equalisation charging), and when the system is in a temperate climate.
The factor almost no guide mentions: battery degradation over time
Every battery chemistry loses capacity with each cycle. This is not a defect — it is chemistry. The question is how fast it happens and whether your system was designed to account for it.
A typical LFP battery loses approximately 2–3% of its original capacity per year under normal residential use conditions (80% DoD, temperatures below 35°C, regular full charges). After 10 years, you can expect approximately 75–80% of original capacity to remain. Under harsher conditions — high temperatures, frequent deep discharges, irregular charging — that figure drops faster.
What this means for your design: If you size a battery to exactly meet your load on day one, the system will begin to underperform within three to five years as capacity shrinks. The correct approach is to apply an ageing reserve factor of 1.2× to your calculated battery capacity. This means a system that needs 4.0 kWh of usable storage should be specified at 4.8 kWh, leaving a 20% buffer that the battery naturally “consumes” over the first decade of operation.
This single correction — missing from every competing guide — can be the difference between a system that performs reliably for 15 years and one that needs premature battery replacement at year seven.
Step 3: Size Your Battery Bank Correctly
With your load figure and chemistry chosen, you can now calculate the required battery capacity. The formula that most guides provide is incomplete — it omits several efficiency and safety factors that significantly affect the real-world result.
The complete battery sizing formula
Battery capacity (kWh)=DoD×Round-trip efficiency×Inverter efficiency×Ageing factorDaily load (kWh)×Days of autonomy
Applied to our case study cabin:
| Parameter | Value | Notes |
|---|---|---|
| Daily load | 1.3 kWh | From load table above |
| Days of autonomy | 2 days | Minimum for tropical climate (2-day rainy periods common) |
| DoD (LFP) | 0.85 | 85% depth of discharge |
| Round-trip efficiency | 0.95 | LFP is ~95% efficient |
| Inverter efficiency | 0.93 | Typical for quality MPPT inverter-charger |
| Ageing factor | 1.20 | 20% reserve for 10-year degradation |
Required capacity=0.85×0.95×0.93×1.201.3×2=0.8992.6≈2.89 kWh
Round up to the next available product size: 3.0 kWh (e.g., one 48V 60Ah LFP module).
Compare this to what you get if you omit the ageing factor and round-trip efficiency: 1.3 × 2 ÷ 0.85 = 3.06 kWh, which looks similar — but that naive calculation also omits inverter losses, meaning the system is under-specified at every efficiency loss point simultaneously, compounding the shortfall.
Voltage selection and wiring configuration
48V is the recommended bus voltage for the vast majority of modern residential and off-grid systems. Here is why:
- At 1 kW of power, a 48V system draws ~21A versus ~83A on a 12V system. Lower current means thinner, cheaper, cooler-running wires and smaller fuses.
- Nearly all modern hybrid and off-grid inverters are 48V native.
- High-voltage lithium battery systems (150–500V) are increasingly common for grid-tied installations using inverters from SolarEdge, Goodwe, or Fronius — but these require inverter-specific battery packs and are not interchangeable.
On connecting multiple batteries:
If your capacity requirement exceeds a single battery module, connect additional units in parallel to add capacity while maintaining 48V. Limit parallel strings to a maximum of three to avoid cell imbalance caused by minor voltage differences between strings. If you need more than three parallel strings, it is more efficient and safer to connect more cells in series (increasing voltage per string) and use an inverter rated for that higher voltage.
How temperature affects usable capacity
Temperature is the most underappreciated design variable in solar battery systems, and it matters most at the extremes.
In hot climates (consistently above 35°C): LFP batteries lose approximately 5–10% of usable capacity at 45°C compared to their rated performance at 25°C. More critically, every 10°C increase above 25°C roughly doubles the rate of capacity degradation over time. If your battery enclosure is unshaded metal in a tropical climate, the actual internal temperature can reach 50–55°C on a hot afternoon. This does not just reduce today’s capacity — it accelerates ageing dramatically. Mitigation: ventilated enclosure with airflow, shade from direct sun, ideally air-conditioned battery room for large installations.
In cold climates (below 0°C): LFP batteries should not be charged below 0°C — the lithium ions cannot intercalate properly into the anode, causing irreversible plating damage. Most quality BMS units include low-temperature charge cutoff protection. However, discharge is possible at lower temperatures, with capacity dropping approximately 20% at -10°C and up to 40% at -20°C. Off-grid systems in cold climates need either battery heating pads (drawing a small but real parasitic load) or a heated enclosure.
For our Southeast Asian case study: The primary concern is heat, not cold. We applied an additional 1.05× temperature derating factor to our battery sizing, increasing the specified capacity from 3.0 kWh to 3.15 kWh. We rounded to 3.2 kWh to accommodate this.
Step 4: Size the Solar Array to Reliably Charge Your Batteries
The solar array must do two things simultaneously: power your daytime loads and fully recharge the battery bank within the available daylight hours. Getting this balance wrong in either direction causes problems — too small and the battery chronically undercharges; too large (beyond a reasonable margin) and you pay for generation that has nowhere to go.
Finding your Peak Sun Hours (PSH)
Peak Sun Hours represents the number of hours per day that your location receives solar irradiance equivalent to 1,000 W/m² (the standard test condition used to rate panels). It is not the same as hours of daylight.
| Location | Annual average PSH | Winter minimum PSH |
|---|---|---|
| Singapore / Kuala Lumpur | 4.5–5.0 h | 3.8–4.2 h |
| Sydney, Australia | 4.5–5.5 h | 3.0–3.5 h |
| Phoenix, USA | 6.0–7.0 h | 4.5–5.5 h |
| London, UK | 2.8–3.5 h | 0.8–1.5 h |
| Munich, Germany | 3.0–3.8 h | 1.0–1.8 h |
| Cape Town, South Africa | 5.5–6.5 h | 4.0–4.5 h |
Always design to the winter minimum PSH, not the annual average. A system that keeps the battery full in June but cannot charge adequately in December is a system that will fail its users when they need it most.
Calculating required array size
Array size (kWp)=PSH (winter)×System efficiencyDaily energy needed (kWh)
System efficiency accounts for wiring losses (~2%), panel temperature derating (~5% for every 10°C above 25°C STC), soiling (~3%), and MPPT efficiency (~97%). A composite system efficiency of 0.80–0.85 is a reasonable real-world assumption.
For our case study cabin (tropical, PSH winter minimum = 4.0 h):
The system must generate enough to cover loads and recharge the battery. Daily generation needed:
- Daytime loads: ~0.6 kWh (approximately half the daily total)
- Battery recharge from overnight discharge: ~1.3 kWh ÷ 0.95 (inverter) = ~1.37 kWh
- Total daily generation target: ~1.97 kWh
Array=4.0×0.821.97≈0.60 kWp
We specified four × 200W panels (0.80 kWp total) — approximately 33% oversized relative to the minimum calculation. This is intentional. At current panel prices (roughly $0.20–0.30/Wp installed for budget systems), the cost of two extra panels is modest. The benefit is that the battery reaches full charge even on partially overcast days, which in tropical climates occur 40–60% of the time.
Oversizing the array is generally the right call in 2025. Panel costs have fallen 90% over the past decade. Adding capacity costs far less than it used to, while the resilience benefit — fewer days of insufficient charge, less generator runtime — remains constant.
Step 5: Select the Inverter, Charge Controller, and BMS
These three components are where design decisions become brand-specific and where specification errors are most costly to fix after installation.
Inverter selection: what actually matters
Continuous power rating (kW) — size this first. Your inverter must handle the maximum simultaneous load you will ever draw. From our load table, the largest single load is the water pump at 300 W, but running the pump while the refrigerator cycles and lighting is on could push simultaneous demand to ~450 W. Apply a 1.25× temperature derating factor for tropical climates (inverters lose output capacity when hot): 450 W × 1.25 = 563 W minimum continuous rating. A 1,000 W inverter-charger is the appropriate next size up.
Surge rating — don’t forget it. Motor loads (pumps, fans, compressors) draw 3–5× their rated wattage for 1–3 seconds at startup. A 300 W pump may demand 900 W momentarily. Your inverter’s surge rating must exceed this figure, or the inverter will shut down every time the pump starts. Most quality inverter-chargers have surge ratings of 2–3× their continuous rating — confirm this in the specification sheet.
kW vs kVA — a common source of confusion. Many manufacturers list inverter size in kVA (kilovolt-amperes) rather than kW (kilowatts) because the kVA figure is always larger and looks more impressive. The conversion is: kW = kVA × power factor (typically 0.8). A “5 kVA” inverter delivers approximately 4.0 kW of real power. Always use the kW figure when comparing to your load calculations.
AC-coupled vs DC-coupled architecture:
| DC-coupled | AC-coupled | |
|---|---|---|
| How it works | Panels → charge controller → battery → inverter | Panels → solar inverter → AC bus → battery inverter |
| Typical efficiency | Higher (~95–97%) | Slightly lower (~92–94%) due to double conversion |
| Best for | New installations | Retrofitting battery to existing solar system |
| Flexibility | Less flexible for adding existing solar | Existing solar PV inverter can remain |
| Common products | Victron Multiplus + MPPT, Growatt SPF, Schneider XW+ | Enphase IQ Battery, SolarEdge StorEdge |
For new off-grid and hybrid installations, DC-coupled systems are generally more efficient and simpler. For homeowners who already have a functioning grid-tied solar system and want to add battery storage, AC-coupling is usually the path of least disruption.
Charge controller: MPPT vs PWM
The decision rule is straightforward:
- PWM (Pulse Width Modulation): Only appropriate when the panel string voltage matches the battery voltage. Inexpensive but inefficient with mismatched voltages — can waste 20–30% of potential generation.
- MPPT (Maximum Power Point Tracking): Continuously adjusts the operating point of the panels to extract maximum power regardless of the voltage differential between array and battery. For any system above ~400 W, MPPT consistently outperforms PWM by 15–30% in real-world conditions and pays for its higher cost within one to two years.
Use MPPT. In 2025, there is no good reason to specify PWM for a new system unless you are building something very small (under 200 W) and cost is the only consideration.
The BMS: the component most DIY guides underexplain
The Battery Management System is the electronic brain that keeps lithium batteries safe. Its six core functions are:
- Overcharge protection — disconnects charging when any cell reaches maximum voltage (typically 3.65V per LFP cell)
- Over-discharge protection — disconnects the load when any cell drops below minimum voltage (typically 2.5V per LFP cell)
- Overtemperature protection — halts charging or discharging when cell temperature exceeds safe limits
- Short circuit protection — immediately disconnects in the event of a dead short
- Cell balancing — redistributes charge between cells to ensure they age uniformly
- State of Charge (SoC) monitoring — tracks and reports remaining capacity to the user and the inverter
Active vs passive balancing: Passive balancing dissipates excess energy from higher-charged cells as heat — simple and cheap, but wasteful. Active balancing transfers energy from higher cells to lower ones — more complex and expensive, but more efficient and better for long-term cell health. For large battery banks (above 10 kWh), active balancing is worth the additional cost.
The real risk of skipping or underspecifying the BMS: In a documented 2022 residential fire incident in Australia, an undersized BMS failed to detect a cell imbalance in a DIY LFP bank. One cell overcharged, entered thermal runaway, and ignited the adjacent cells before the BMS disconnected the circuit. The BMS is not an optional accessory — it is the primary safety system for lithium battery installations.
Does It Actually Save You Money? Life Cycle Cost and Payback Analysis
This is the chapter that every competitor’s guide omits. Knowing how to design a system is only useful if you also know whether you should build one.
Understanding LCOE (Levelised Cost of Energy)
LCOE represents the total cost of generating and storing one kilowatt-hour of electricity over the system’s entire lifetime. It allows you to compare the true cost of your solar battery system against what you would pay by simply staying on the grid.
Total lifetime cost includes:
- Initial equipment cost (panels, batteries, inverter, BMS, wiring, mounting)
- Installation labour (if using a professional)
- Battery replacement cost (typically at year 10–12 for LFP under normal use)
- Maintenance (annual inspection, cleaning, connection checks)
- Monitoring system (optional but recommended)
For our Southeast Asian case study cabin:
| Cost component | Amount |
|---|---|
| 4 × 200W panels | $320 |
| 10 kWh LFP battery module | $800 |
| 1,000W hybrid inverter-charger | $280 |
| MPPT charge controller (integrated) | Included above |
| Wiring, fuses, breakers, mounting | $180 |
| BMS (integrated in battery) | Included |
| Installation (DIY, professional inspection) | $150 |
| Total initial cost | $1,730 |
| Battery replacement at year 12 (estimated, adjusted for inflation) | $500 |
| Maintenance over 20 years | $400 |
| Total lifetime cost | $2,0 |
Total lifetime energy generated: 1.3 kWh/day × 365 days × 20 years × 0.88 (average efficiency accounting for degradation) = 8,350 kWh
LCOE=8,350 kWh$2,630≈$0.315/kWh
In many parts of Southeast Asia, grid electricity costs $0.10–0.18/kWh. In this scenario — off-grid, where the alternative is a diesel generator — the economics are strongly positive: diesel generation typically costs $0.40–0.80/kWh all-in. The solar battery system pays for itself in roughly 3–4 years against the generator baseline.
Payback period calculation for grid-connected homes
For homeowners connected to the grid, the calculation shifts:Simple payback (years)=Annual electricity bill savingsTotal system cost
Annual savings depend on:
- Local electricity price (varies from $0.08/kWh in parts of the US to $0.40/kWh in Germany or Australia)
- Time-of-use tariff structure (battery value increases dramatically with peak/off-peak price spreads)
- Net metering or feed-in tariff policy (NEM 3.0 in California, for example, significantly reduced the value of exported solar energy in 2023, making battery storage more attractive for self-consumption)
- Available incentives (US Investment Tax Credit at 30%, various state rebates, Australian STC scheme)
A realistic range for residential grid-connected systems in 2025:
- High electricity price + good incentives (Australia, Germany, California): payback 6–9 years
- Moderate electricity price + moderate incentives (most of the US): payback 9–14 years
- Low electricity price + few incentives: payback 15–20+ years (marginal case)
When solar battery storage does not make financial sense
Honest advice requires acknowledging the scenarios where the numbers do not work:
- Very low local electricity prices (below $0.10/kWh): the savings per kWh stored are too small to justify the capital investment within a reasonable timeframe
- Very low energy consumption: a household using less than 5 kWh/day in a temperate climate with cheap grid power often cannot justify a battery system on financial grounds alone — backup power resilience becomes the primary justification
- Poor solar resource combined with high battery cost: some northern European locations have winter PSH values below 1.5 hours; oversizing the array to compensate makes the system uneconomical
If you fall into one of these categories, that is genuinely useful information — it may point you toward efficiency improvements first, or toward a grid-tied solar system without battery storage as a more appropriate intermediate step.
Real Case Study: Designing a Complete Off-Grid System Step by Step
Everything covered so far has been illustrated with the same example. Here is how the full design came together — including the mistakes made and corrected along the way.
Project background
Location: Rural coastal area, peninsular Malaysia Climate: Tropical, year-round heat (28–38°C), frequent afternoon thunderstorms June–September Daily load: 1.3 kWh (from the load table above) Budget: USD $1,500–$2,000 for equipment Constraints: No licensed electrician available locally; owner is technically competent but not a professional; system must be maintainable without specialised tools
Design decisions and final component list
| Parameter | Calculated | Specified | Notes |
|---|---|---|---|
| Daily load | 1.3 kWh | — | From load table |
| Battery capacity required | 2.89 kWh | 3.2 kWh | Includes ageing + temperature factors |
| Battery voltage | — | 51.2V | Standard for this system size |
| Solar array | 0.60 kWp min | 0.80 kWp | 33% oversize for tropical cloud resilience |
| Inverter | 563W min | 1,000W | Next standard size; surge handles pump |
| Charge controller | — | Integrated MPPT | Included in inverter-charger unit |
The mistakes made and corrected
Mistake 1: The first inverter choice was incompatible. The initial plan specified a 24V inverter to save money. After ordering the 48V battery module, it became clear that 24V and 48V systems are not interchangeable — the charge controller within the inverter-charger operates at a fixed bus voltage. The 24V unit was returned (thankfully before installation) and a 48V unit ordered. Lesson: specify battery voltage first, then choose the inverter around it.
Mistake 2: The battery enclosure was initially too airtight. The first enclosure was a sealed plastic box intended to keep out insects. After the first hot afternoon (battery surface temperature reaching 47°C), the BMS triggered an overtemperature disconnect, cutting power. A 40mm ventilation opening was added to the top and bottom of the enclosure, creating passive convective airflow. Battery temperature dropped to 39°C under the same ambient conditions. Lesson: in hot climates, ventilation is not optional.
Mistake 3: The surge current of the water pump was underestimated. The 300W pump was drawing an estimated 900W startup surge. When the refrigerator compressor happened to cycle on at the same moment as the pump started, the combined surge exceeded the inverter’s 2,500W surge rating and triggered a fault shutdown. Solution: a 5-second startup delay relay was installed on the pump, preventing simultaneous startup with the compressor. Total cost: $12. Lesson: calculate surge loads for each motor independently and consider simultaneous startup scenarios.
Measured system performance after six months:
- Average daily generation: 3.1 kWh (4.0 kWh on clear days, 0.8 kWh on heavy overcast)
- Average battery SoC at dawn: 68% (indicating healthy overnight cycling)
- Generator required: zero times in six months
Upgrading or Expanding an Existing System
A large proportion of people designing “new” solar battery systems are actually modifying an existing installation. The decisions are different — and the risks are higher.
Upgrading from lead-acid to LFP
This is the most common upgrade scenario, and it is almost never as simple as swapping the battery modules.
Charging voltage incompatibility: Lead-acid batteries charge to a different voltage profile than LFP. A charge controller or inverter-charger configured for lead-acid (absorption voltage ~14.4V for 12V systems, ~57.6V for 48V) will overcharge LFP batteries (maximum charge voltage ~54.6V for 48V LFP), which damages cells over time even if the BMS does not immediately disconnect. You must either reconfigure the charge controller to LFP parameters (most modern units allow this via settings) or replace it with an LFP-compatible model.
Capacity reconfiguration: LFP delivers usable capacity at 85–90% DoD versus lead-acid at 50% DoD. A 100Ah lead-acid bank provides approximately 50Ah of usable capacity. A 100Ah LFP bank provides approximately 85Ah. This means you may not need to increase nominal capacity at all when upgrading — the same Ah figure delivers significantly more real-world energy. Recalculate your system from the sizing formula above rather than simply matching the old battery’s nameplate.
Minimum steps for a safe lead-acid to LFP conversion:
- Reprogram charge controller and inverter for LFP voltage parameters
- Verify the BMS in the new LFP module is rated for the full charge and discharge current of your system
- Replace any lead-acid-specific temperature compensation sensors (they apply a correction that LFP does not need and which will cause incorrect charging)
- Update any low-battery alarms or generator auto-start setpoints to LFP voltage thresholds
Expanding an existing battery bank
Adding capacity to an existing battery system seems straightforward but carries real risks if done incorrectly.
Never mix old and new batteries in the same bank if the existing batteries have more than 20% capacity degradation. The newer, higher-capacity cells will discharge preferentially to compensate for the weaker cells, accelerating wear on both groups and risking BMS-triggered disconnects.
The inverter’s charge current limits your maximum practical battery capacity. An inverter-charger with a 30A charging current can deliver: 30A × 48V = 1,440W of charging power. To recharge a 10 kWh battery from 20% SoC in 8 hours of sunshine requires: 8 kWh ÷ 8h = 1.0 kW of charging power, well within the 1.44 kW limit. But recharging a 20 kWh bank under the same conditions requires 2.0 kW — exceeding the inverter’s charging capacity and meaning the battery will never reach full charge in a single day. Check this constraint before specifying additional battery capacity.
Safety, Permits, and Monitoring: the Steps Most People Skip
Electrical safety fundamentals
Solar battery systems operate at potentially lethal voltages and currents. A 48V system at 100A discharge can deliver 4,800 watts — enough to cause severe burns or death through electrical shock, and enough current to sustain an arc flash if a connection fails.
Minimum safety requirements for DC wiring:
- Fuse or circuit breaker on every positive conductor, sized at 125% of maximum expected current
- DC-rated disconnect between battery and inverter, accessible for emergency shutdown
- Appropriate wire gauge: use the 3% voltage drop rule — the resistance of the wiring should not cause more than 3% voltage drop at maximum current. For a 48V system at 50A over a 3-metre cable run, 6mm² cable is the minimum; 10mm² is more conservative and recommended
- AFCI (Arc Fault Circuit Interrupter) protection on DC circuits is required under NEC 690 in the United States and increasingly required under IEC 62109 in other markets
- Grounding: all metal enclosures, panel frames, and the negative bus of ungrounded systems must be bonded to earth ground
When you need a licensed electrician: In most jurisdictions, any grid-connected system requires a licensed electrical contractor to make the utility interconnection. Even for off-grid systems, building codes in many areas require a licensed inspection of the electrical installation. Check local requirements — operating an uninspected system can void homeowner’s insurance and create liability in the event of a fire.
System monitoring: knowing what your system is actually doing
A system without monitoring is a black box. You will not know when the battery is underperforming, when a cell is drifting out of balance, or when your generation has dropped due to a dirty panel or a partial shade obstruction.
| Monitoring solution | Cost | Key features | Best for |
|---|---|---|---|
| Victron VRM portal | Free (with Victron hardware) | Remote access, historical data, alerts | Victron-based systems |
| Enphase Enlighten | Free (with Enphase hardware) | Panel-level monitoring, consumption tracking | Enphase microinverter systems |
| SolarEdge monitoring | Free (with SolarEdge hardware) | String-level monitoring, optimiser data | SolarEdge systems |
| Home Assistant (DIY) | ~$50 hardware | Fully custom, local or cloud, any brand | Technical users, mixed-brand systems |
Four metrics to monitor daily:
- State of Charge (SoC) at dawn — should be above 30% for LFP under normal conditions
- Daily energy generated (kWh) — compare against your design expectation; sustained underperformance indicates shading, soiling, or cell degradation
- Battery temperature — alert if above 40°C or below 5°C during charging
- Cell voltage spread — if individual cell voltages diverge by more than 50mV during charge or discharge, active balancing is required or cells may need replacement
How many solar panels do I need to charge a 10 kWh battery?
It depends on your location’s peak sun hours and how quickly you need to recharge. In a location with 4.5 PSH, charging a 10 kWh battery (assuming you discharge it to 20% SoC, so 8 kWh needs to be replaced) in one day requires: 8 kWh ÷ 4.5 h ÷ 0.82 efficiency = 2.17 kWp of panels, or approximately seven to nine 300W panels. In a location with 2.0 PSH (northern Europe in winter), you would need twice as many panels for the same recharge time.
What size battery do I need to run a house for 3 days?
Calculate your daily household consumption from your electricity bill (typically 10–30 kWh/day for a family home in a developed country). Apply the full sizing formula: Daily load × 3 days ÷ (DoD × round-trip efficiency × inverter efficiency × ageing factor). For a 15 kWh/day household with LFP at 85% DoD: 15 × 3 ÷ (0.85 × 0.95 × 0.93 × 1.20) = 60 kWh nominal capacity. This is a large residential BESS installation — expect costs of $15,000–$30,000 installed.
Is LFP better than lead-acid for solar storage?
For long-term residential and off-grid use, yes — in almost every scenario. LFP has 4–8× the cycle life, 70% higher usable capacity per nominal kWh, better performance in heat, no maintenance requirements, and no hydrogen off-gassing risk. The higher upfront cost per kWh is offset by the dramatically lower cost per cycle over the battery’s lifetime. The sole remaining advantage of lead-acid is lower upfront cost for short-term or low-cycle applications.
How long does a solar battery system last?
A well-designed LFP system with appropriate sizing, BMS protection, and temperature management will maintain above 80% capacity for 10–15 years. The solar panels themselves typically carry 25–30 year performance warranties and will continue producing at 80% or better for that period. The inverter-charger is usually the first major component to require replacement, typically at 10–15 years depending on thermal management and usage intensity.
What is the average cost to install a solar battery system?
Costs vary significantly by market, system size, and labour rates. Rough installed cost ranges in 2025:
Small off-grid system (1–3 kWh): $1,000–$3,500 (DIY) / $3,000–$7,000 (professional)
Residential grid-tied battery (5–15 kWh): $8,000–$25,000 installed, before incentives
After US Investment Tax Credit (30%): subtract 30% from equipment and installation costs
After Australian STC rebate: reduces upfront cost by $1,500–$4,000 depending on location and system size